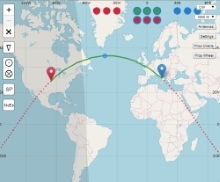
With the availability of the complete final log of the DXpedition I worked on it with Excel, moved by curiosity to compare, within certain limits, the openings of propagation actually occurring from Liberia with those theoretical estimated by the various VOACAP based software.
In particular, I focused the analysis on the openings to the States.
The limits of this work are:
- stations operating in Liberia were not a beacon, so there were not active for all 24 hours on each band, even 5M2TT operators have had to eat and had to rest ... ;
- in the intervals of 24 hours during which a given station was operating on a given band, the antenna was not always pointed at the States;
- there have been frequent blackouts during operations.
Let's see how I made the charts.
First of all, I extrapolated from the log all the QSOs with the States. I then sorted them by date. For each day I have then sorted by band and then by time.
I was able, in this way, calculating for each hour of each day and each band QSOs made by 5M2TT with the States (by call area to W9 W0, excluded and KL7 KH6). Obtained these data, it was then easy to create the graphs. From them you have an idea of the openings from Liberia with the States during the 14 days of DXpedition.
For each of these graphs obtained with Excel I then made, where possible, a comparison with the graphs obtained with WinCAP before the beginning of the DXpedition. These were related to the path EL-USA and in each of them you can see the curves of the estimated S / N ratio for all U.S. call-areas.
The above comparison was made for the HF classic bands.
To you comment.
Grazie alla disponibilità del log completo definitivo della DXpedition ho potuto lavorarci su con Excel, mosso dalla curiosità di confrontare , entro certi limiti, le aperture di propagazione effettivamente verificatesi dalla Liberia con quelle teoriche stimate dai vari software basati sul VOACAP.
In particolare ho concentrato l'analisi sulle aperture verso gli States.
I limiti entro cui mi sono mosso sono:
- le stazioni operanti dalla Liberia non erano un beacon, quindi non erano costantemente attive per tutte le 24 ore su ciascuna banda, anche gli operatori di 5M2TT si sono dovuti cibare e hanno dovuto riposare... ;
- negli intervalli delle 24 ore durante i quali una data stazione era operativa su una data banda, non aveva l'antenna sempre puntata verso gli States;
- si sono verificati frequenti black-out durante le operazioni.
Spiego ora come ho realizzato i grafici.
Prima di tutto ho estrapolato dal log tutti i QSO con gli States. Li ho poi ordinati per data. Per ciascun giorno li ho poi ordinati per banda e quindi per orario.
Ho potuto , in questo modo, calcolare per cascuna ora di ciascun giorno e per ciascuna banda, i QSO fatti da 5M2TT con gli States (call area da W0 a W9, esclusa KL7 e KH6). Ottenuti questi dati, è stato poi semplice realizzare i grafici veri e propri. Da essi si ha un'idea delle aperture dalla Liberia con gli States durante i 14 giorni di DXpedition.
Per ciascuno di tali grafici ottenuti a posteriori con Excel ho poi fatto, ove possibile, un confronto con i grafici ottenuti con WinCAP prima che iniziasse la DXpedition. Questi ultimi erano relativi alla tratta EL-USA e in ciascuno di essi sono visibili le curve stimate del rapporto Segnale/Rumore relative a tutte le call-areas USA.
Il suddetto confronto è stato fatto per le bande HF classiche.
A voi commentare.


 ), direi che le curve si somigliano molto, evidenziando ancora una volta l'efficacia dei programmi di predizioni, Wincap soprattutto che è molto pro, peccato non sia free...
Commenta