Let's see the
situation with the solar cycle # 25. All data needed for
the following charts comes from the Space Weather Canada, SIDC and
WSO. Unless
otherwise indicated, I refer the "adjusted" values of the solar flux,
corrected (by Space Weather Canada) to refer to the average Earth-Sun
distance (1 Astronomical Unit).

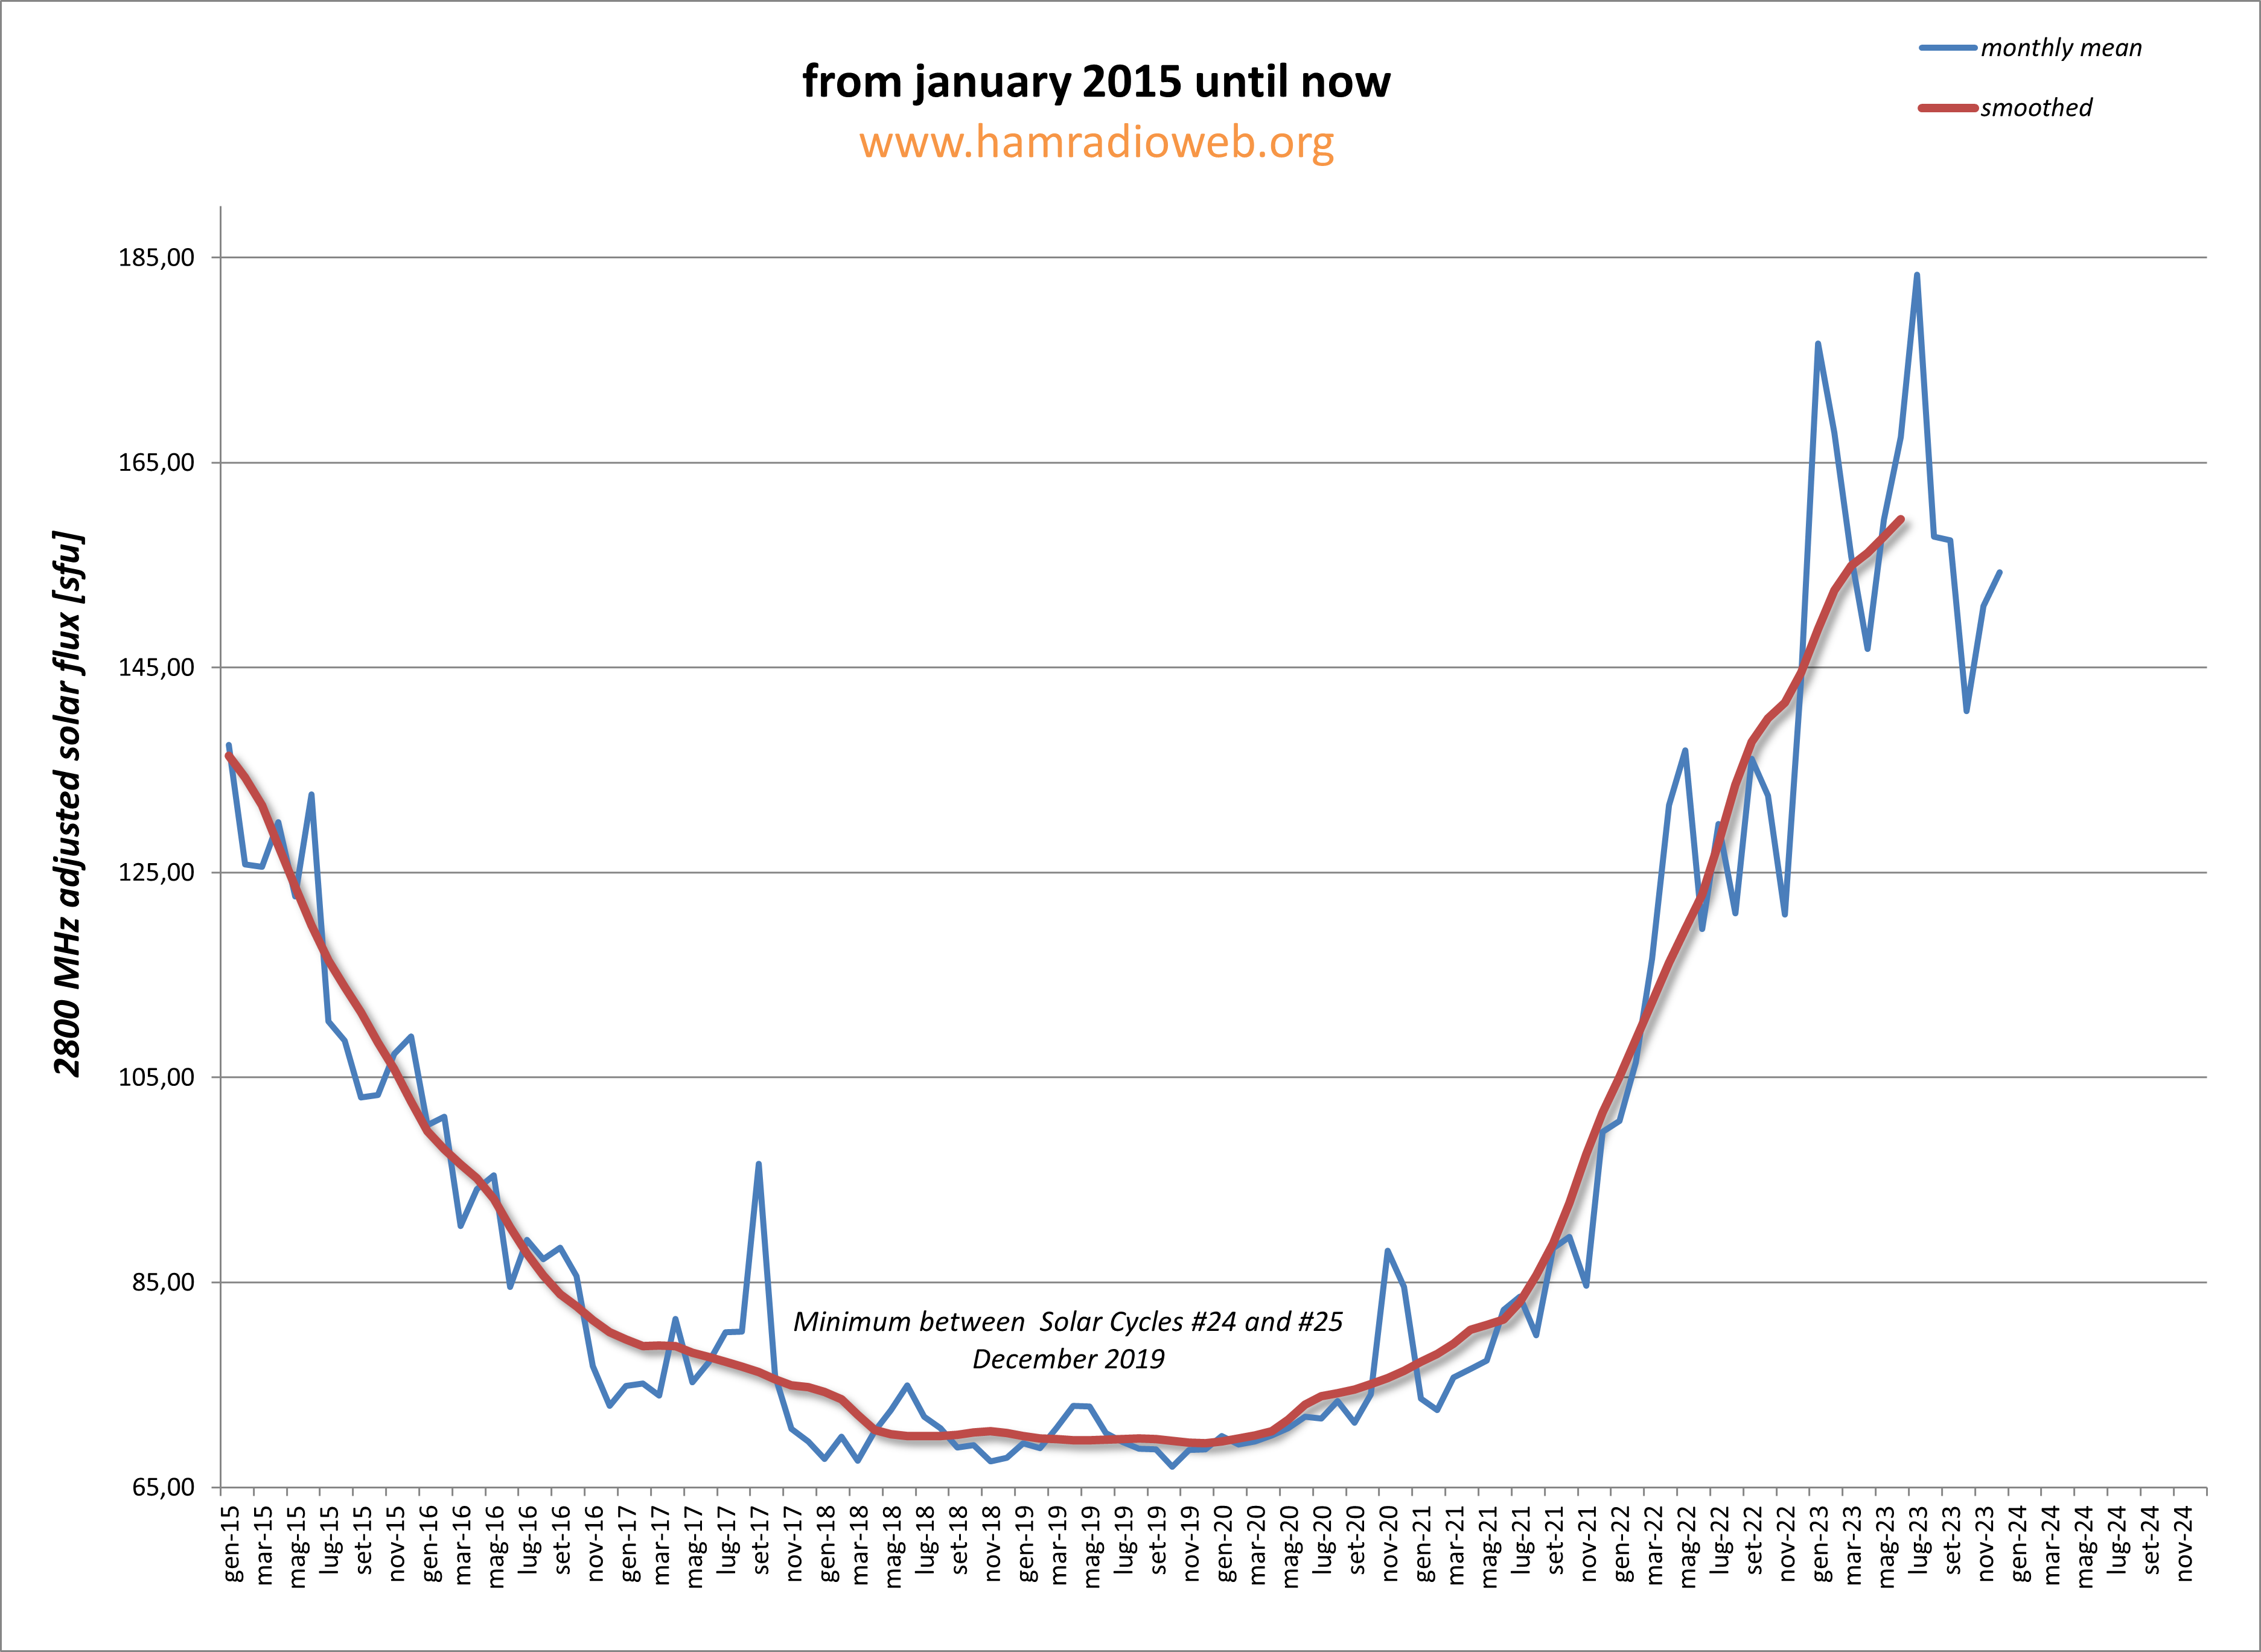
This
is the graph of the solar flux on 2800MHz from the month of the
previous minimum smoothed solar flux (December 2019) to the present. The
blue curve is the monthly mean value of solar flux, while the red one
is the smoothed value.

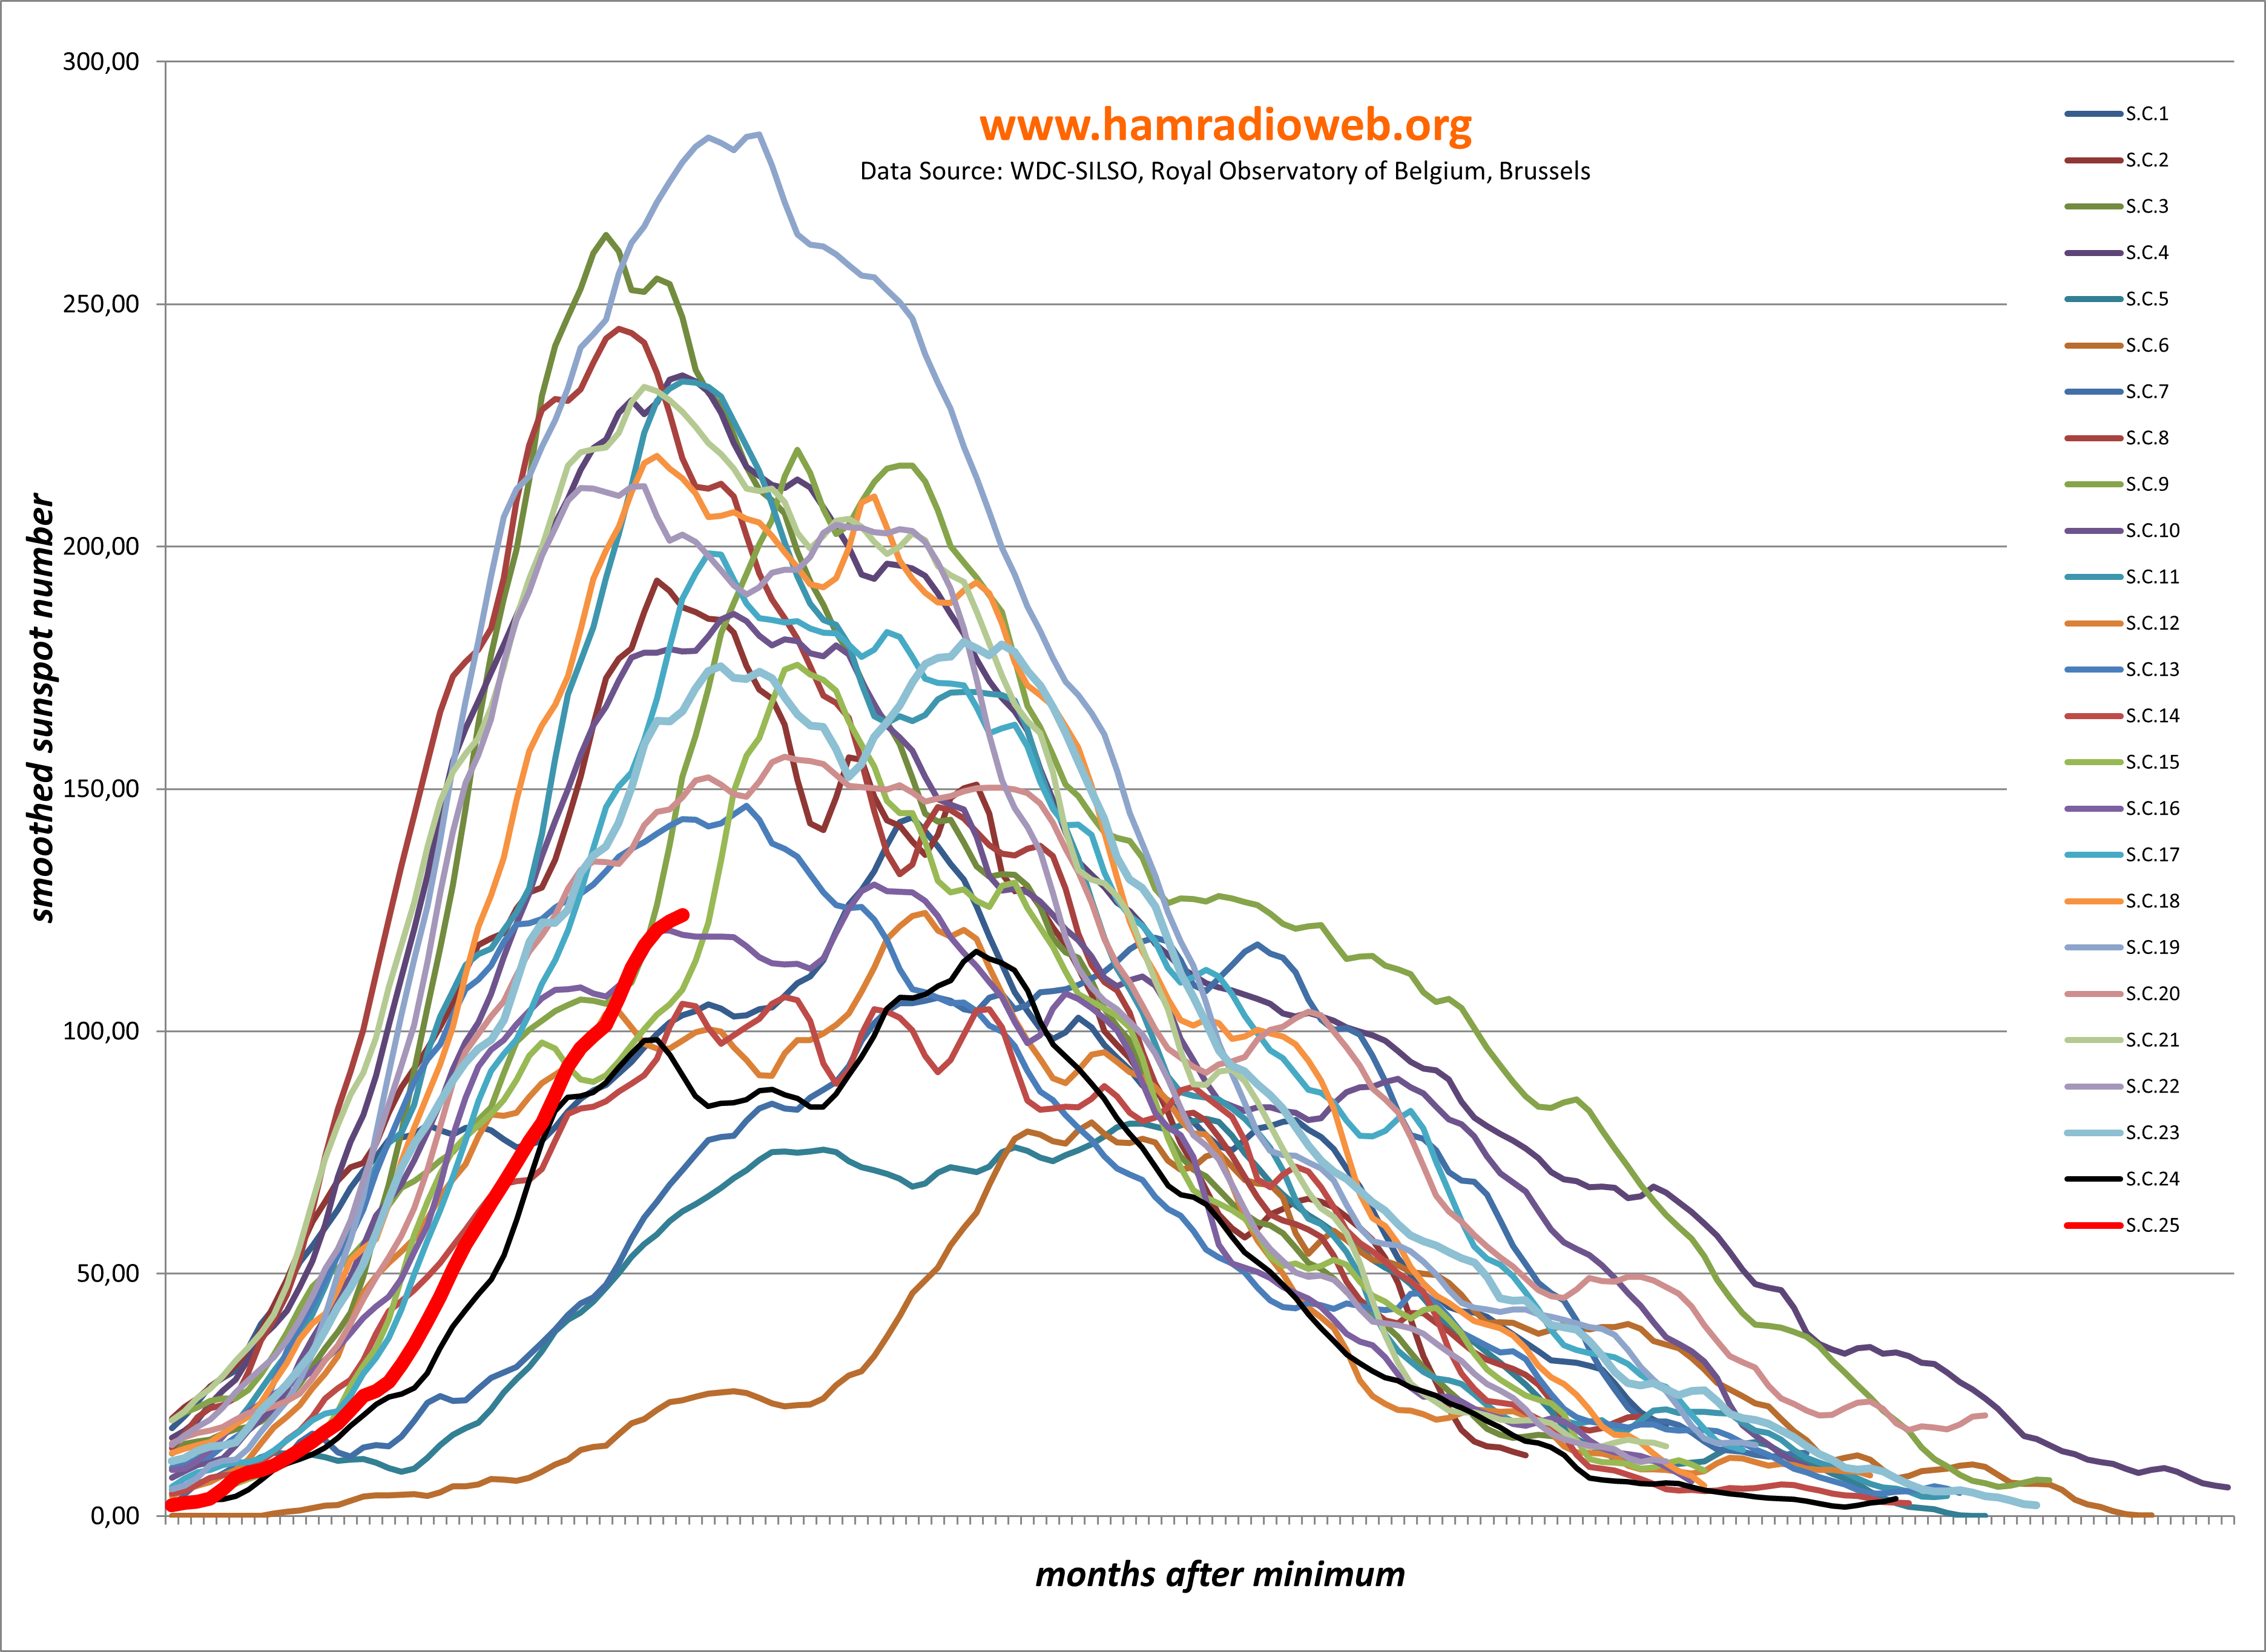
This
chart is the comparison chart, in terms of Smoothed Sunspot Number,
between the solar cycle #25 and all the previous ones. It starts from
the month of the previous minimun smoothed sunspot number (december 2019). The curve of the solar cycle
#25 is the red one.

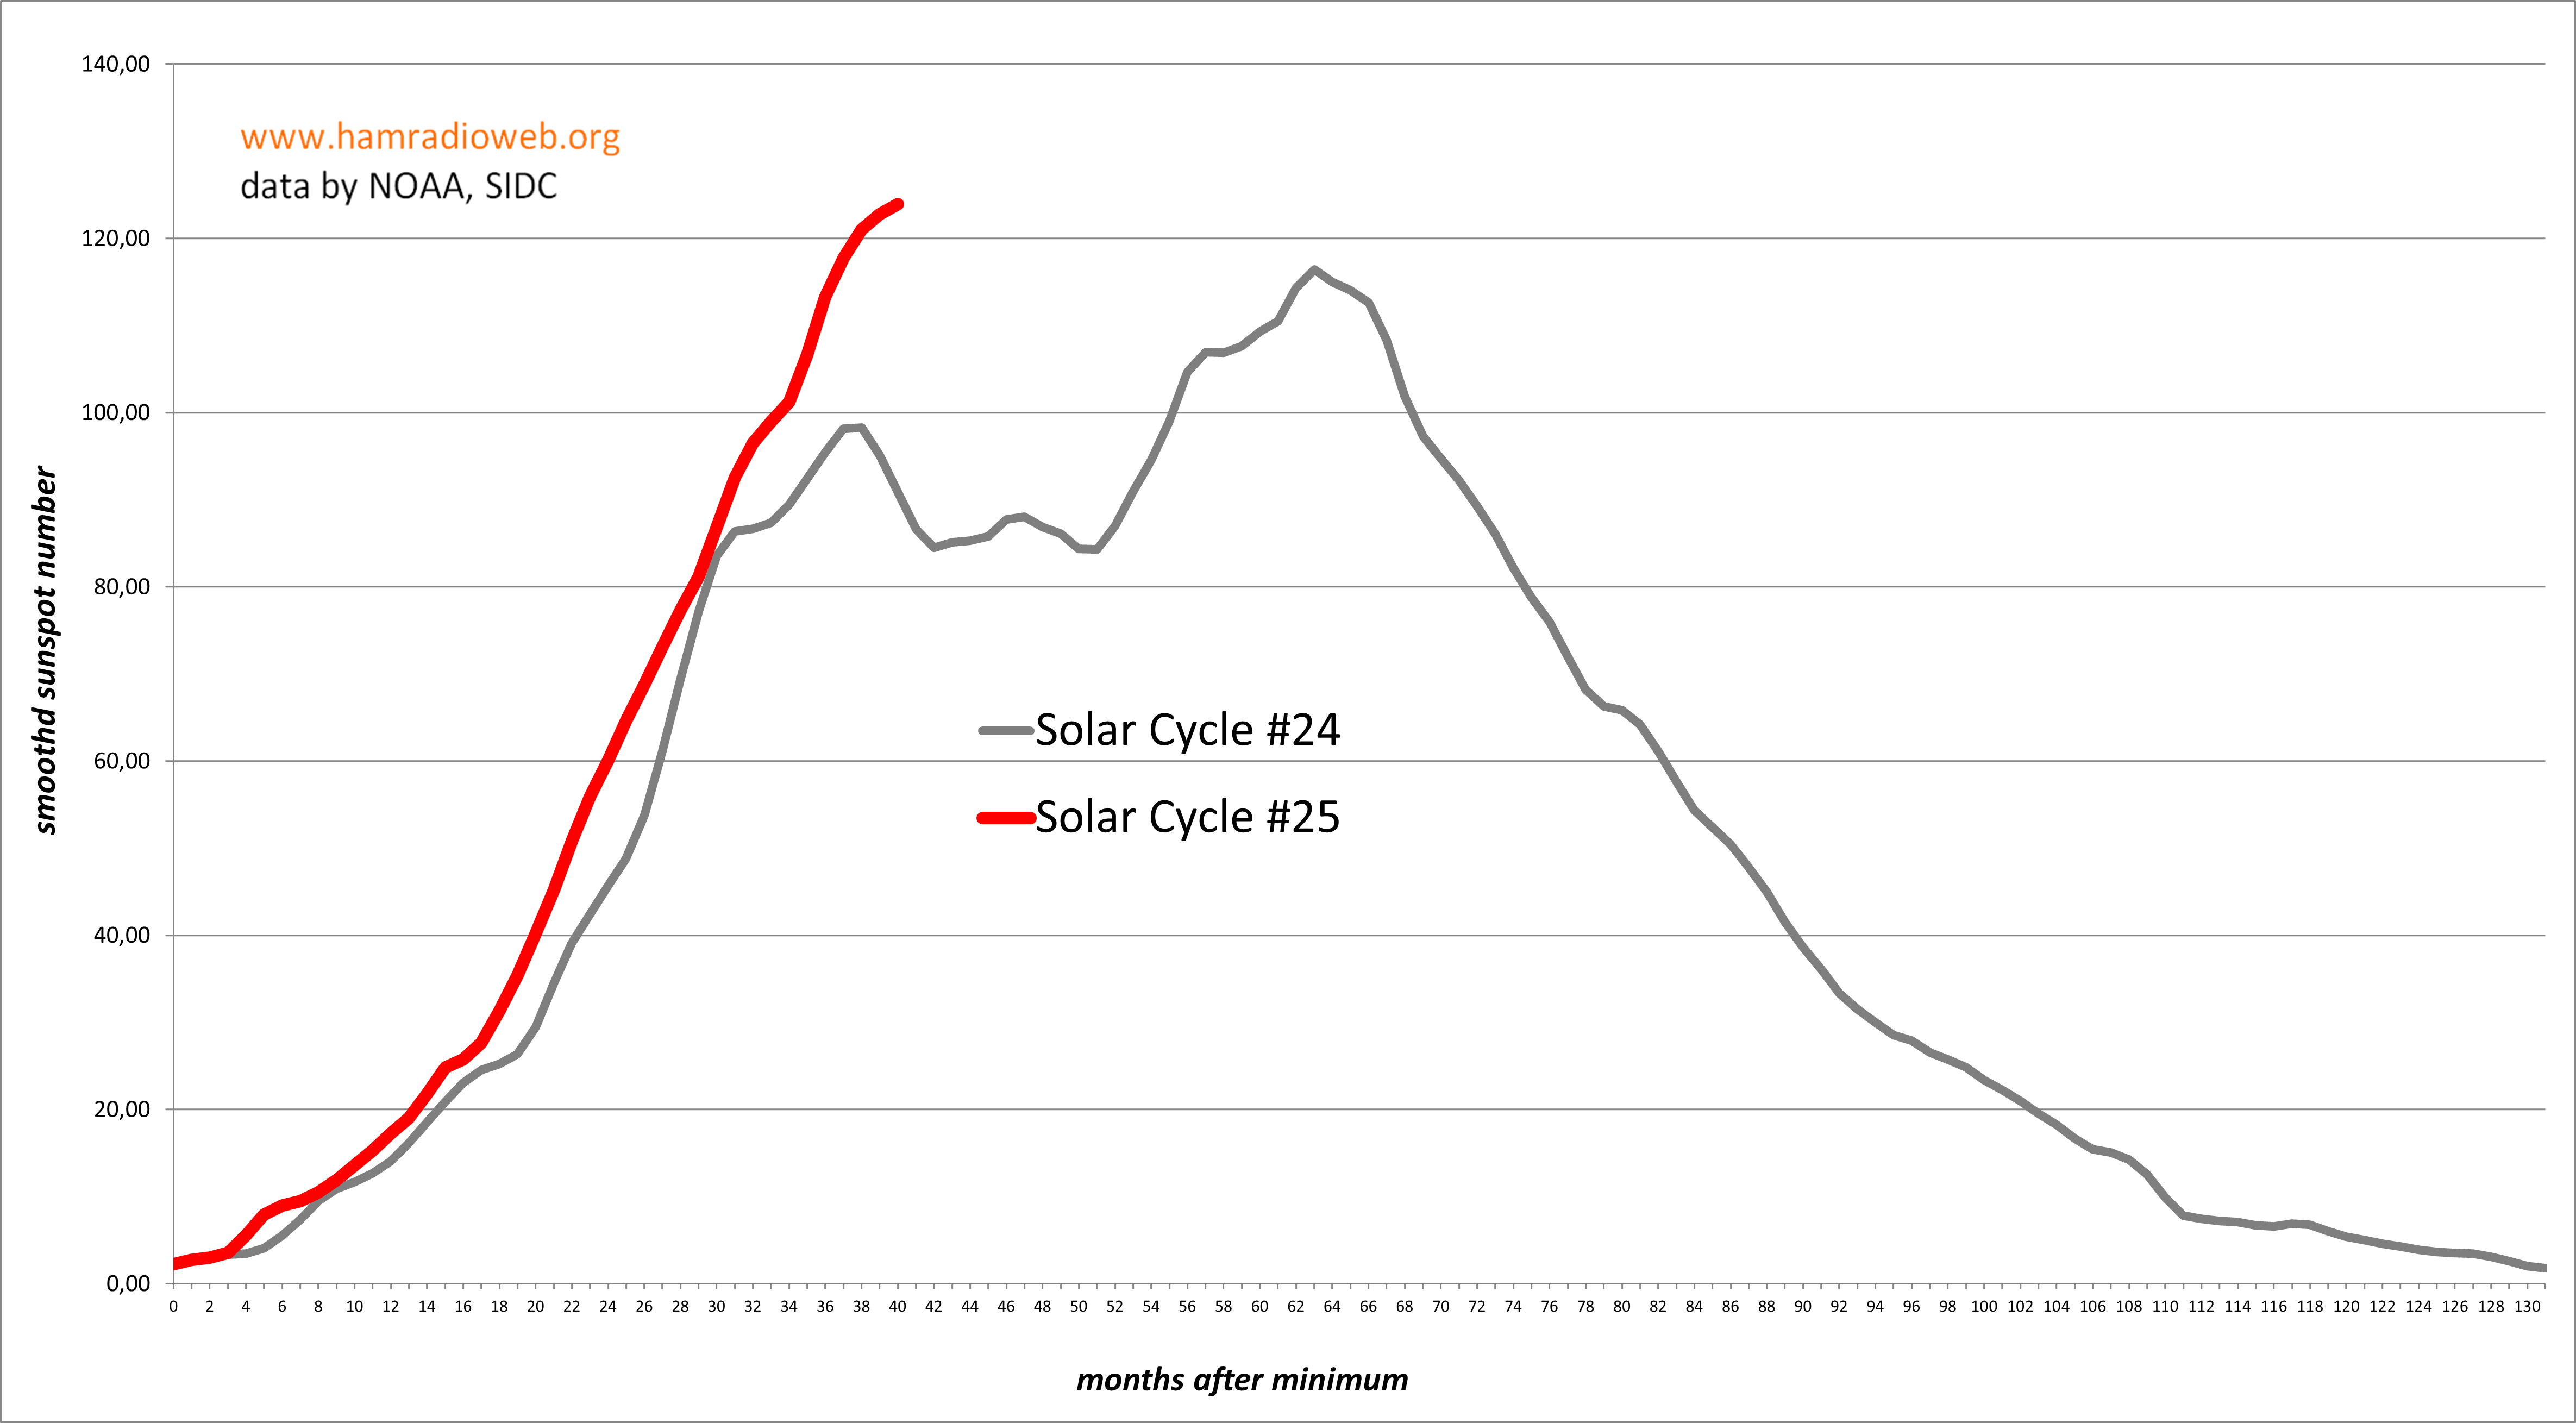
This is the comparison chart between the SSN curves of solar cycles #24 and #25